Domain Time II Audit Server can raise various alerts based on information collected during collection runs and from real-time data provided by Server and Client.
In order for Audit Server to provide alerts, you need to configure the alert thresholds and the type of alerts desired.
Select Audit Server -> Alerts and Audit Groups -> Configure from the Manager menu.
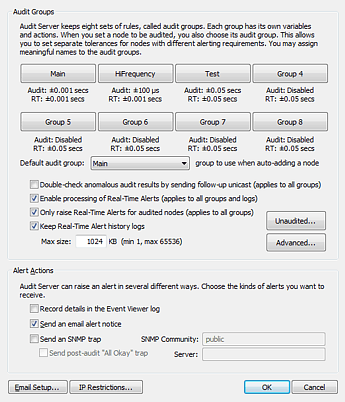
Audit Groups
As of v5.2.b.20180601, you can set alerts and notifications for up to eight custom-designated groups. On older versions, only
one global set of alerts and notifications can be configured.
Each Audit Group has its own individual set of alert thresholds and notification lists. Once you've defined an audit group,
you can assign any machine shown in Manager nodes lists to the group by clicking on the Audited field to select the desired group name.
Note: When upgrading from older versions of Audit Server, any machines previously set to be audited will be automatically assigned to Group 1. You may then re-assign them to any group you choose.
On the Audit Groups page, you can also set basic Real-Time Alert global defaults, Real-Time Alert defaults for machines that are set to unaudited, and other Advanced Real-Time Alert configuration options.
Audit Groups
Click the button corresponding to the audit group you want to configure. See detailed instructions below:
Default audit group sets the group to which machines are auto-added if they are added with auditing enabled.
Double-check anomalous test results by sending a follow-up unicast (applies to all groups)
For speed and efficiency, Audit Server first requests audit results by broadcast/multicast. Check this box if not all your machines respond reliably to initial scans
(you can see this in the Audit Server log). Although enabling this function is more robust, it may significally slow down audits if you have a large number of non-responding machines, since timeouts
are invoked for each audited machine that does not respond.
Enable processing of Real-Time Alerts (applies to all groups and logs)
Enable/disable overall Real-Time Alerting.
Only raise Real-Time Alerts for audited nodes (applies to all groups)
Typically, Real-Time Alerts may be raised for machines whether or not they are set to be audited. This setting restricts them to audited nodes.
Keep Real-Time Alert history logs
Max size: KB (min 1, max 65536)
When enabled, Audit Server keeps a separate log of all Real-Time Alert activity (found in the
\Program Files\Domain Time II\RT Alert History folder)
Click the button to set Real-Time Alert parameters for unaudited machines.
These settings are very similar to the Real-Time Alert settings for the individual audited groups (See detailed instructions below). Email alerts for
these machines can only be directed to the global email distribution list.
Click the button to set additional parameters for Real-Time Alerts on the Advanced Real-Time Alert Configuration dialog page.
These options are covered in the Advanced Settings section at the end of this document:
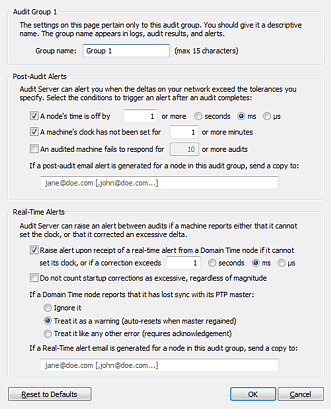
Configure Audit Group
You may configure the individual alerts configuration for each Audit Group by clicking on its corresponding button.
This brings up the Configure Alerts dialog for the selected group.
Use the Group Name field to set the audit group name. This is the name is used in displays, reports, and alerts.
Post-Audit Alerts
These alerts are raised after a scheduled or manually-triggered Audit Run. These thresholds are used to determine which machines raise alerts.
A node’s time is off by
secs ms µs
Any audited machine with a time delta exceeding this value (as compared to the Reference Time) will raise an alert.
A machine’s clock has not been set for or more minutes
Any audited machine that has not set its time more recently than this value will raise an alert.
An audited machine fails to respond for or more audits
An alert is raised if an audited machine hasn't responded for this number of audits.
If a post-audit email alert is generated for a node in this audit group, send a copy to:
You may enter a custom list of email addresses to which this alert should be sent. Note: basic email settings must first be configured
using the global Email Configuration setup (detailed below). This custom list is in addition to the default recipients specified in the global Email Configuration.
Global recipients always receive all emails. Individual recipients specified in each group's settings will only receive alert
emails pertaining to that one group. If you leave this field blank, alerts will be sent to the default list of recipients (if enabled).
Configure Nodes for Real-Time Alerts
Each Server and Client must be configured to send Real-Time Alert Data to the Audit Server before alerts can be generated. This can be done by:
Configuring the Audit Server Real-Time Alerts section of the Status Reports property page on the Server or Client Control Panel applet.
Selecting machines on the Details Pane of Manager's Real-Time Alerts category and right-clicking to choose Enable Real-Time Alerts from the context menu.
Real-Time Alerts appear in the Real-Time Alerts category of Domain Time Manager. Alerts persist until they are dismissed from Manager (by right-clicking the machine's name in the Real-Time Alerts display and
choosing Reset Alert item from the context-menu. Real-Time Alerts will also be sent using email if configured. Machines still in alert status at the time of an audit
run will also be summarized in Audit summary emails.
Real-Time Alerts
Domain Time Servers and Clients can send Real-Time Alert data to Audit Server during each time check/statistics roll-up
event scheduled on the Timings page).
See the Configure Nodes for Real-Time Alerts sidebar on the right for setup instructions.
This data can be evaluated and used to raise an alert based on the threshold value you specify in this section.
Raise alert upon receipt of a real-time alert from a Domain Time node if it cannot
set its clock, or if a correction exceeds
secs ms µs
Do not count startup corrections as excessive,
regardless of magnitude
You may instruct Audit Server to not raise an alert based on the first Real-Time response after a component restarts.
This prevents spurious alerts during service startup, since the first correction of the clock is often very large.
If a Domain Time node reports that is has lost sync with its PTP master:
This setting controls how to handle alerts when slaves lose their PTP Master:
Ignore it Treat it as a warning (auto-resets when master regained) Treat it like any other error (requires acknowledgement)
If a Real-Time alert email is generated for a node in this audit group, send a copy to:
You may enter a custom list of email addresses to which this alert should be sent. Note: basic email settings must first be configured
using the global Email Configuration setup (detailed below). This custom list overrides the default email distribution recipients
specified in the global Email Configuration. If you leave this field blank, alerts will be sent to the default list of recipients (if enabled).
Advanced Real-Time Alert Settings
To configure Advanced Real-Time Alert settings, click the
button on the Configure Alerts and Audit Groups dialog page.
These selections allow you to group your alerts together to prevent being overwhelmed by immediate alerts, or to receive them individually as they occur.
The Max backlog: setting controls how many older queued alerts should be displayed when a backlog occurs. You shouldn't have to adjust this value unless your server is extremely busy and
real-time alerts are regularly being dropped in normal use. If you set this value too large, you may have stale data appearing when a machine is rebooted.
Alert Sharing and the Alert Viewer
If this option is enabled, you may monitor the status of your Real-Time alerts using the Domain Time II Alert Viewer (see below).
This port is also used if you are using the Audit Server Standby Mode. If you are not using the Alert Viewer or Standby Mode, you may disable this option.
Force Auto-Manage Windows Firewall
As of Version 5.2.b.20150828, Domain Time supports automatic management of the Windows Firewall to allow access to the required time protocol and control ports.
See Auto-Manage Windows Firewall Settings
for a detailed explanation.
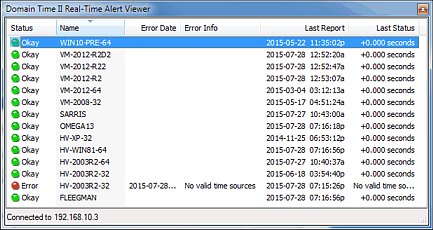
Domain Time II Alert Viewer applet (DTALERT.EXE)
Audit Server includes a handy Alert Viewer applet that can display the alert status from any/all Audit Servers on your network on any Windows desktop (XP and above) you'd like. It also gives you a handy customizeable desktop clock display.
This allows you to have a visual indicator of the status your entire time network on your desktop, or any other system where that information would be useful. It also makes an excellent desktop clock.
The Alert Viewer applet program is named DTALERT.EXE. The program comes in both 32 and 64-bit versions.
If your Domain Time II Manager is 64-bit, the 64-bit version will be located in the C:\Program Files\Domain time II\ folder, and the 32-bit version will be in the C:\Program Files\Domain time II\i386\ folder.
Conversely, if your Domain Time II Manager is 32-bit, the 32-bit version will be in the C:\Program Files\Domain time II\ folder, and the 64-bit version will be in the C:\Program Files\Domain time II\AMD64\ folder.
You may copy the DTALERT.EXE file to any machine you'd like (be sure to copy the correct 32 or 64-bit version to match the type of machine), and then run it to configure the clock display and current alert status of your Audit Server(s).
You may run as many copies of DTALERT.EXE on various machines as you need.
The program will display the current date and time on your desktop along with a colored flag representing the current alert level.
The Alert Viewer shows the current overall alert status present on your monitored Audit Servers. The flag next to the clock will change
color to reflect the worst reported status of any monitored system (green, yellow, or red). A white flag indicates the software cannot contact any Audit Servers.
As of 5.2.b.20170101, you can also enable audio alerts to be notified by a sound when the status changes.
Double-click any part of the clock display to show the alert status of the individual machines providing Real-Time alerts to the monitored Audit Server(s).
Note: The software only reports alert status. To reset or configure alerts, you must use the Manager on the the Audit Server machine(s) actually collecting the Real-Time alerts.
To configure the program options, run DTALERT.EXE and right-click on any part of the clock to display the context menu.
Clock - These context menu items let you control the appearance and function of the desktop clock display. You can set attributes such as font, color, background, opacity, etc.
Status - These settings control the display of alert data from your selected Audit Server(s).
Visible - sets whether the Real-Time Alert Viewer status windows is open and visible. This window displays the status of all machines reporting real-time alerts to your selected Audit Server(s).
You can toggle whether this window is open by double-clicking on any part of the clock display.
Servers - This is where you tell the viewer which Audit Server(s) you want it to monitor for alerts. Enter the DNS Name or IP address of each Audit Server.
Note that Alert Sharing over port 9910 TCP must also be enabled on each listed Audit Server (see above).
Date/Time Format - This lets you set the format for all dates and times displayed on the status viewer.
Start at Logon - When this item is checked, the Alert Viewer will automatically load whenever you log in.
Auto-Acknowledgement of Resolved Alerts
If this option is enabled, Audit Server will automatically acknowledge Real-Time Alert warnings for machines that are not still in an error state. The machines will return to green status after the period of time you specify here.
If unchecked, machines that had an issue will stay in the yellow warning state until manually acknowledged using Domain Time Manager.
Auto Purge of Stale Real-Time Alerts
Available as of version 5.2.b.20250101. When checked, "Stale" refers to a node that is no longer sending Real-Time Alerts,
either because the node has been decommissioned or it has been configured to stop sending Real-Time Alerts.
This function is essentially the same as selecting a node from Manager's Real-Time Alert page and deleting it.
If a deleted node begins sending Real-Time Alerts again, it will automatically be added back to the list. The
default period of time that must pass before a node is considered stale is 60 days. The allowed range is
1-365 days. Auto-cleanup activity shows in Audit Server's log at the Trace level. If enabled, cleanup runs
at service startup and periodically thereafter.
Alert Actions
Choose your desired alert method in this section. You can also enable/disable these items directly on the Audit Server -> Alerts and Audit Groups menu.
The SNMP alerts and Email items require additional configuration.
SNMP Configuration
Enter the SNMP community name and password used by your Network Management System (NMS), as well as its DNS name or IP address. Your community name and password must match the one in use by the receiving system.
Best Practices for SNMP include using a unique community name and hard-to-guess password on production systems.
The default community public should only be used for initial testing. Although Domain Time only sends outgoing trap information and is therefore
not susceptible to SNMP remote control vulnerabilities, you should still be mindful of SNMP security for the benefit of your other SNMP devices.
The Domain Time MIB File
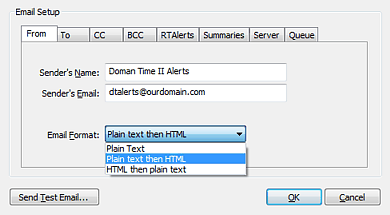
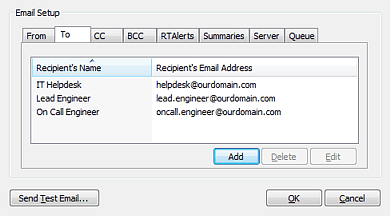
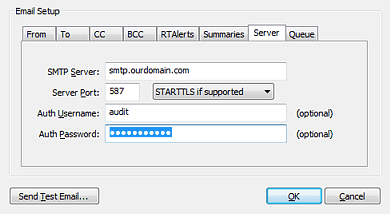
Email Configuration
Click the button to
configure your Email Settings (or choose Audit Server -> Email Setup from the Manager menu).
You must configure these email settings before Audit Server can send notification emails.
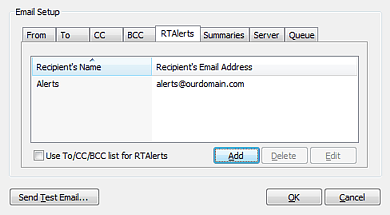
As of version 5.2.b.20160922, Audit Server has the ability to send Real-Time Alert and Daily Summary emails to a different distribution
list than the addresses used in the TO/FROM/BCC settings. To use this feature, uncheck the Use To/CC/BCC list... checkbox and enter the email addresses
you want to use for the distribution list. If enabled, Real-Time Alerts and/or Daily Summaries will only go to the addresses listed here, they will no longer be sent
to the TO/CC/BCC address lists.
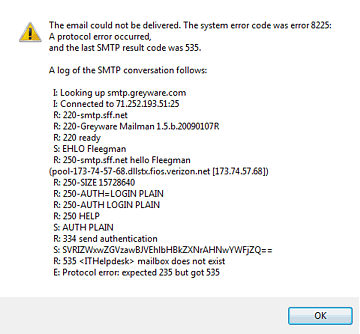
Send Test Email
Once you have entered all of the above information, click the Send Test Email button to generate a test email.
If your test email encounters any errors, you'll receive a pop-up window showing the entire SMTP conversation so
you can easily troubleshoot the problem:
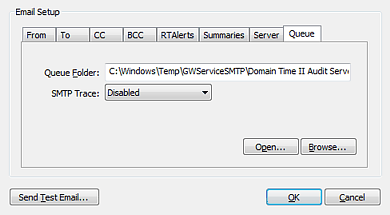
This page contains the settings for the email queue and email logs.
The Queue Folder: specifies the location of the folder where outgoing emails are queued.
The email.log trace file is also kept in this folder.
Note: In most cases, you will not need to adjust this location. If you do decide to change the folder location, you must
pick a location on a local disk (not a networked share) with sufficient permissions (Change) granted to the
Audit Server service account so that it is able to manage the queues.
Use the SMTP Trace:
drop-down list to select the level of detail you want to keep in the email.log trace file.
In general, you should only enable the trace file if you are troubleshooting an email delivery issue. Otherwise, your
email.log file may grow to an unmanageable size over time.
Use the Open or Browse buttons to open the queue folder and locate the email.log file, which
is a plain text file you can open in any editor, such as Notepad.
Advanced Configuration: Email-related registry settings
Depending on your email server configuration, you may also need to adjust these additional settings in the Windows registry.
Email registry settings are located in the
HKEY_CLASSES_ROOT\Gap\GWServiceSMTP key.
TLSIgnoreCertErrors (REG_DWORD)
Introduced in v5.2.b.20140922 with default=0 (ignore no errors). As of v5.2.b.20160711, the default changed to 0x311 (accept certs that are self-signed, expired, or have the wrong CN)
If this value is zero, the server cert must pass all tests. If the value is non-zero, it is a bitmask specifying which
particular types of errors may be ignored. See Microsoft's documentation
for a list of certificate errors that may be ignored. Use a logical OR to combine multiple values.
0x00000080 - Ignore errors associated with certificate revocation
0x00000100 - Ignore errors associated with an unknown (or self-signed) certificate authority
0x00000200 - Ignore errors associated with wrong use of a certificate
0x00001000 - Ignore errors associated with an invalid/mismatched common name
0x00002000 - Ignore errors associated with an expired certificate
You may set the value to 0x10000000 in order to regain strict certificate checking, 0x0000FFFF to disable certificate checking altogether, or any combination of the above values.
TLSAcceptableProtocols (REG_DWORD)
Introduced in v5.2.b.20160711. This is a bitmask of acceptable encryption protocols.
The default value is 0x0AA0. Use a logical OR to combine multiple values.
0x00000002 - PTC1 (not recommended)
0x00000008 - SSL2 (not recommended)
0x00000020 - SSL3 (not recommended, but included in default for backward compatibility)
0x00000080 - TLS 1.0 (not recommended, but included in default for backward compatibility)
0x00000200 - TLS 1.1
0x00000800 - TLS 1.2
0xFFFFFFFF - any available protocol (not recommended)
FQDN (REG_SZ)
Introduced in v5.2.b.20160711. This value contains the name to use during SMTP envelope negotiations; specifically, it is the name presented as the
HELO or EHLO name immediately after receiving the server's greeting.
In previous versions, the name used was the sending machine's fully-qualified
host name. However, workgroup members or machines just starting may only have a bald hostname available. This new value is set the
first time an email is sent, and used thereafter for all subsequent emails. If a fully-qualified name is not discoverable,
then Domain Time will use either a dotted-quad IP enclosed in brackets, or the computer name followed by .smtp.local.
RFC 2821 section 4.1.1.1 requires one of these two forms. You may change the name if your particular email server requires
an externally-verifiable DNS name to be presented.
As of v5.2.b.20170522, you may also customize the subject lines of your alert emails by making a change in the registry.
See the SMTP section of the registry documentation.
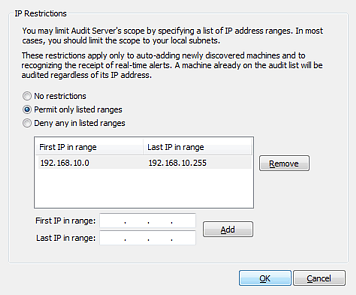
IP Restrictions
Click the button to restrict which systems are allowed to contact Audit Server.
You can both permit and deny access from IP ranges. To restrict a single IP address, enter the same IP address for both the First and Last range items.