Domain Time II Monitor Service
Version 5.2
Domain Time II Monitor Service is a system service that periodically collects variance statistics from Domain Time Servers
and Clients across your entire network. It also raises alerts if time variance on any running machine that exceeds the tolerances you specify.
Note: The Monitor Service is intended only for simple "snapshot" monitoring tasks. Use Domain Time II Audit Server,
to provide more capable monitoring and record-keeping. Audit Server adds auditing of NTP and Windows Time systems
(using the Domain Time Windows Time Agent), more robust automatic discovery, notifications of non-responding machines, custom reports, SNMP and other real-time alerts, etc.
Installation
System Requirements
Additional Requirements
Verify that your environment meets the minimum requirements for performing remote monitoring using Domain Time Monitor.
- Since variance reporting and alerting depends on accurate time calculations, Monitor Service should always be run on a physical (not virtual) machine.
- To monitor machines on your local subnet, your local network must allow UDP broadcast traffic sent to destination port 9909.
- To monitor machines on remote subnets, your network must pass UDP multicast traffic sent to destination port 9909. Switches and firewalls
must also pass UDP unicast traffic sent to destination port 9909 bi-directionally between subnets, since unicast traffic will originate
either from Monitor or the remote machines.
Installation
The Monitor Service is installed and its applet launched from Domain Time II Manager.
Click Utilities --> Monitor Service on the Manager's menu. If Monitor Service is not installed, you'll be prompted
to install it.
Once the Monitor service has been installed, you configure it using its Control Panel applet. You can launch the applet from Manager (see above),
from the Control Panel, or you may also launch the Domain Time II Monitor Service program (and many other installed Domain Time II components)
by right-clicking on the Domain Time icon in the System Tray to bring up the context menu.
Note: On systems with User Account Control (UAC) enabled, you may need to Shift+Right Click and choose Run As... from the context
menu to launch the Control Panel applet as Administrator. On Windows Server Core, type in domtimem.cpl on the
command line.
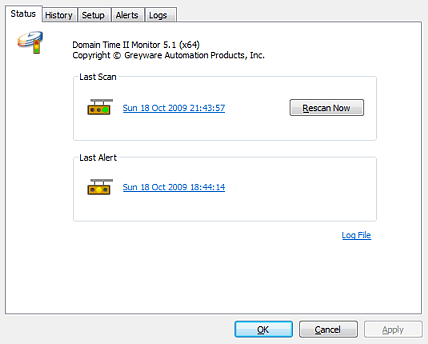
The Control Panel Applet - Status tab
The first tab page of the applet shows the time/date and status of the last variance scan and last alert raised.
If this is the first time the
applet has been launched, it will run a scan automatically. You can also trigger a Rescan from this tab page.
Click the link in each section to see the detail summary report from either the last scan or the most recent scan that resulted in an error.
You can also view the service log by clicking the Log File link.
 Proceed to the History page Proceed to the History page
|
|