Schedule Tab Page Audit List Tab Page Discovery Tab Page Alerts & Logs Tab Page Cache Tab Page Advanced Settings Tab Page

 Top of Page

 Documentation\Configuration\Audit Server\Alerts & Logs
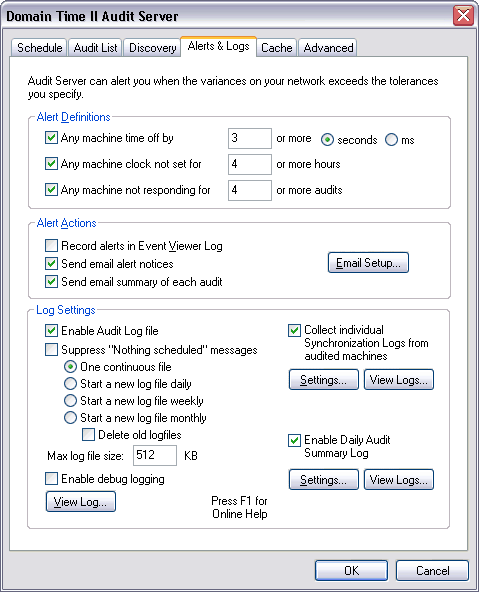
    Settings on this tab page controls whether Audit Server will generate alerts if machines fail to be synched or audited properly, and also how Audit Server maintains its various log files.

    Domain Time II Audit Server - Alerts & Logs Tab

    Alert Definitions


      Audit Server can be set to verify the validity of the time sync and the availability of the audited machines every time an audit is performed. If any machine exceeds the thresholds you specify here, an alert will be generated so that you may address the issue.

      Any machine time off by or more seconds ms
      Sets the maximum amount of variance allowed from the Reference Clock used during the audit. This setting also controls which events are flagged with a warning in the Synchronization Logs. You may specify this threshold value in seconds or milliseconds.

      Any machine clock not set for or more hours
      Flags any machines that haven't synced their time with a time source within the minimum time limit indicated here.

      Any machine not responding for or more audits
      Flags any machines that haven't responded to the Audit Server for this number of audit requests in a row.

    Alert Actions


      Record alerts in Event Viewer Log
      Writes the alert information to the Windows Event Logs.

      Send email alert notices
      Instructs Audit Server to send the alert notices to the user(s) configured on the Email Setup dialog page.

      Send email summary of each audit
      Instructs Audit Server to send an email summary of each audit to the user(s) configured on the Email Setup dialog page.

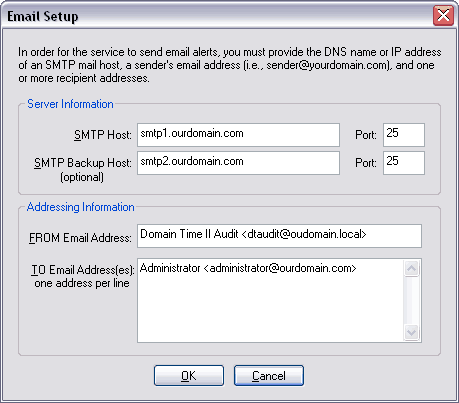
      To configure who will receive the email alert messages or summary reports selected above, click the Email Setup button to bring up the Email Setup screen:
      Email Setup Dialog
      Domain Time II Audit Server Control Panel - The Email Setup Screen

      You must specify at least one valid SMTP server, a valid FROM: address, and at least one valid TO: address in order for the email alerts to be sent correctly.

    Log Settings

      Enable Audit Log file
      Indicates whether you want to have Audit Server's activity logged in the DTAUDIT.LOG file. The log file is stored by default in the %systemroot%\system32 folder.

      Note this log contains only information about Audit Server's own operations, it does not contain the audit records or synchronization logs collected during audits.

        If you have the Audit Log file enabled, you can set how you want Domain Time II Audit Sever to retain the logs over time.

        If you select the One continuous file option, the log will be written to a single file (DTAUDIT.LOG) . You may select the maximum size of this file using the Log Size setting box. Setting this box to 0 allows the file to grow without limitation. When the log reaches the maximum size specified, older events are rolled off to make room for new ones.

        The other log retention settings (Start a new log file Daily, Weekly or Monthly) cause Domain Time II Audit Server to create a new log file on a schedule instead of continuing to write to a single file. This is much more manageable when you have a very active server. You may archive off older files whenever you want and still have a good current history. Log files names will include the date the file was created (i.e. dtaudit.20030601.log indicates the log was started June 1, 2003).

        If the Delete old logfiles checkbox is checked, Audit Server will only keep the current log file.

        Max log file size: sets the maximum size to which the log file is allowed to grow. Set this value to 0 if you don't want the log file to be limited in size.

        The Suppress "Nothing Scheduled" messages checkbox controls whether the message "Nothing scheduled; waiting for next hour" message is written to the log. Audit Server checks every hour to see if there is an audit scheduled. Each time this happens a log entry is generated to indicate the service is operating. You may suppress these messages if you don't want them to be included in the logs.

        Enable debug logging Includes large amounts of detailed debugging information in the DTAUDIT.LOG file. Although this will generate extremely useful information for troubleshooting, use this option cautiously since the log can quickly grow very large.

        View Log...
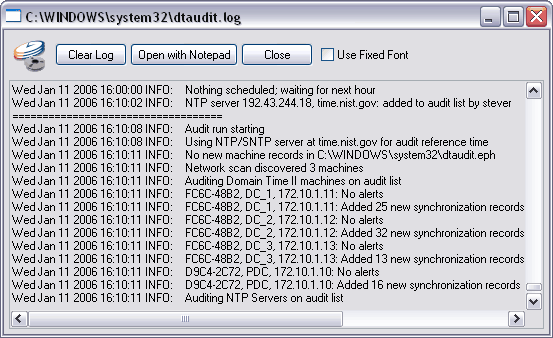
        Use this button to open the built-in Activity Log Viewer where you can view the current log, clear the log, or save it to a file.

          The built-in Log Viewer will show you the current log in real-time.

      Domain Time II Audit Server Control Panel - Log Viewer Screen
      Domain Time II Audit Server Control Panel - Built-in Log Viewer Screen

          Click the Clear Log button to erase the current log, or click the Open with Notepad button to open the log as a text file that you can edit for length and save it under a new name, if desired.

          Clicking the Use Fixed Font box will cause the log viewer text to be displayed in a fixed-width font so that columns line up properly. Unchecking this box will use a proportionally-spaced font so that more of each individual line is visible.

      Collect individual Synchronization Logs from audited machines
      Audit Server can collect the synchronization (drift) logs from each audited Domain Time II machine into a single folder for easy archival or analysis.

        In most cases, the standard audit records Audit Server collects are more than sufficient to demonstrate that any monitored machine is being regularly synchronized, and it does so in an extremely efficient and compact manner. However, some organizations and regulatory bodies (such as NASD OATS) have specific requirements that logs showing every synchronization event be collected and archived.

        Domain Time II (version 3.1 or later) Servers and Clients that run as Windows system services maintain internal drift logs that contain information on each synchronization the component has performed. Drift logs (also referred to here as Synchronization Logs) include information such as the time of synchronization, the time source used, the reason for the check, and the amount of clock correction (if any). These drift logs contain a sizeable, but limited number of the most recent synchronization events, older events are scrolled off to make room for new ones. However, Audit Server can regularly collect the drift logs from multiple machines into a central location to keep a complete historical record of these logs.

        Note: domtimed daemons on UNIX, FreeBSD, Linux, etc. do not keep internal drift logs and therefore Audit Server cannot collect this type of data. However, the other auditing, reporting, and alerting functions of Audit Server are available for these clients.

        NTP Servers do not keep the kind of historical or statistical information that is necessary to compile a complete drift log. However, each time Audit Server audits an NTP Server it does create a special limited drift log file that includes the machine's current time and amount it varied from the reference clock so that you may have a historical record of that data.

        Since drift logs contain only synchronization events in binary format, they are much more compact and suitable for archival purposes than are the normal activity logs each Domain Time II component keeps. Activity logs are in text format and contain system startup events, triggers and cascades received, and other operational information that is usually unnecessary to archive.

        By default, log files are collected into the Program Files\Domain Time II\Synchronization Logs folder.

        Important: Estimate your disk requirements
        The collected synchronization (Drift) logs can grow to very large sizes. The size depends on how many machines are included and how often each one of them is synchronizing. Each time an audit scan is performed, Audit Server appends the new drift data collected to the existing log file. Care needs to be taken to ensure that sufficient disk space to contain these logs is always available. We recommend regular archival and cleanup of this data if the retention settings are not set to limit the log sizes.

        You can calculate the disk space required based on ~20 bytes of log space per synchronization. For example, collecting logs from 10 machines that synchronize themselves an average of once an hour would only use ~ 5k per day. On the other hand, 100 machines that are using broadcast time and being synchronized every minute would generate almost 3 meg of logs per day. Recall also that Audit Records are collected every time sync logs are collected, so be sure to include them in your space calculations. You may use the Audit Space Estimator to calculate disk usage for Audit Records.


        Notes:

        • Synchronization Logs can only be retrieved from Domain Time II Servers version 3.1 and later.
        • The Audit Server service must be set to run using an account that has administrator rights to each Domain Time II Server to be contacted, and has been granted the Log on as a service right. By default, the Audit Server runs in the System context, which does not have rights to remote machines. Use Control Panel-->Services-->Log On to change the Audit Server service to use a domain account.
        • The utility used to view sync logs (DTDRIFT.EXE) does not function on Windows Server Core systems. To view sync logs collected by Audit Server on Server Core systems, you must copy the DTDRIFT.EXE utility from the /System32 folder to a non-Core system and use it from there to view the sync log data files through a network share on the Core machine.

        Synchronization Log Collection Settings
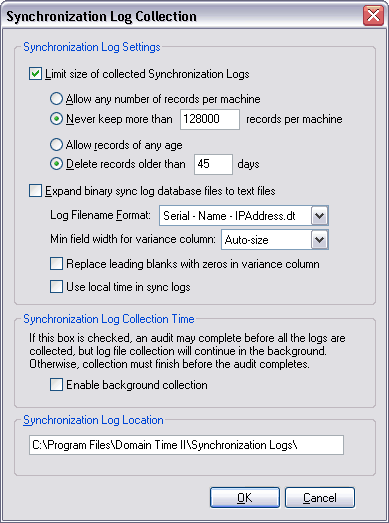
        Click the Settings... button to bring up the dialog where you can set how Audit Server handles the Synchronization Logs.

        Synchronization Log Settings
        The Synchronization Log Collection dialog

          Limit size of collected Synchronization Logs
          You may restrict log size by limiting the number of records kept per machine (older records are rolled off to make room for new entries), and/or by deleting all records over a certain age.

          Expand binary sync log database file to text files
          Enabling this function will cause Audit Server to create a text file version of the binary sync log collection file(s). The text files will be named and formatted according to the settings indicated. You should only use this option if you require a text file be kept for a specific purpose, since the text files are dramatically larger than the binary files. Normally, you would use the View Logs function described below to view the binary files in a more friendly graphical format and generate a text file only if necessary by clicking the Raw Data button on the Log Viewer.

          Enable background collection
          This option causes Audit Server to collect the sync logs in a separate thread from the audit run itself. Collecting sync logs from each audited machine can take an extended amount of time, particularly if you have a large number of machines to audit. Enabling this function allows collection of the basic audit data very quickly, and then the collection of the sync logs can complete in the background.

          Synchronization Log Location
          Specifies the where Synchronization Logs are collected. This should be on a local drive, if possible, since if a remote drive is unavailable at the time an audit is run, any records collected will be lost.

        View Logs...
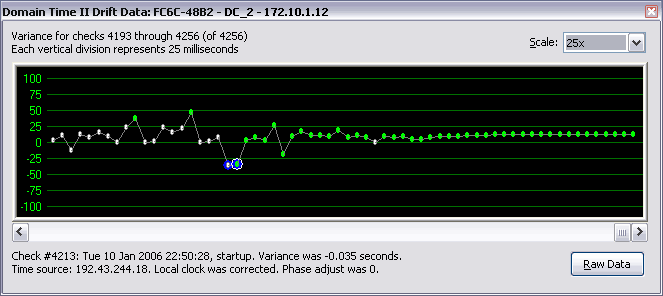
        Click this button to select which Synchronization Log you want to view. When you open a Synchronization Log file, the most recent synchronization events will be graphed automatically. Click on any point to see the specific data. click the Raw Data button to see all of the data collected.

          Note: The utility used to view sync logs (DTDRIFT.EXE) does not function on Windows Server Core systems. To view sync logs collected by Audit Server on Server Core systems, you must copy the DTDRIFT.EXE utility from the /System32 folder to a non-Core system and use it from there to view the sync log data files through a network share on the Core machine.

The Synchronization Log Viewer
The Synchronization Log Viewer, showing the drift graph

        Enable Daily Audit Summary Log tells Audit Server to create a special summary log of audit records each day. This is useful if you are using your own log file collection and analysis program and need the audit record information to appear in a particular format to be imported correctly.

        Notes:

        • Daily Audit Summary Logs only include information from audit records; they do not include information from the Synchronization Logs.
        • The View Logs button displays the contents of the Daily Report Summary collection folder using the Explorer shell which does not function on Windows Server Core systems. Use Notepad to view the files manually or view them from a remote machine using any text reader.

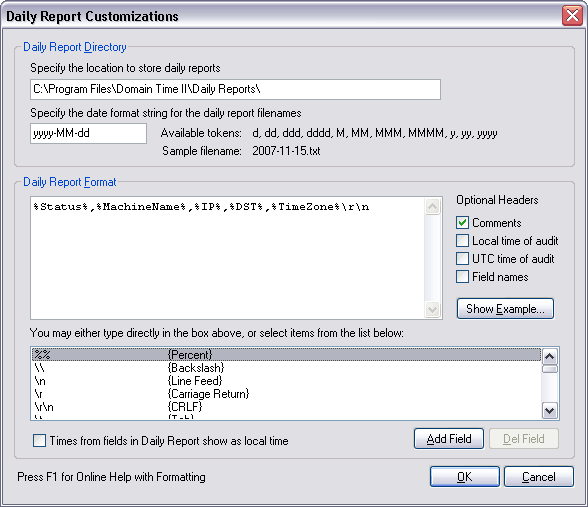
        Click the Settings button to bring up the Daily Report Customizations dialog.
The Daily Report Format Screen
Domain Time II Audit Server Control Panel - The Daily Report Customizations dialog

        A new summary log file will be created in the location you specify each day. Any audits performed during that day will be appended to the log.

        The Daily Report Directory field lets you specify the location where the Daily Summary Logs will be kept. You may specify any valid UNC destination, however, keep in mind that if you specify a location on a remote machine and that machine is unavailable for any reason, records collected during that time will be lost. You may also specify the date format used to create the report's filename.

        The Daily Report Format section is where you specify how data will appear in the log. You can specify the format of the header used before the records as well as the format of the records themselves.

        The format string entered in the text field indicates the order of data variables (keywords surrounded by the % character) which represent specific data collected from the audited machine, special characters (such as \r representing a carriage return), and delimiters (if any) used to create each line of the log file. You can preview the effect of your settings by clicking the Show Example button.

        For example the format string:

          %Status%,%MachineName%,%IP%,%DST%,%TimeZone%\r\n

        results in a log file entry with this format:

          #
          # Audit results from audit performed at 17:00:00 UTC
          #
          # Status,MachineName,IP,DST,TimeZone\r\n
          OK,DC_2,172.10.1.12,Y,Central Daylight Time
          OK,PDC,172.10.1.10,Y,Central Daylight Time
          OK,NTP Server,192.43.244.18,?,Unknown

        Note that the entry for the NTP server in the example above shows ? in the DST and Unknown in the TimeZone fields. This information is only available from Domain Time II components.

        These are the items that can be included in the format string:

        Delimiters
        You may specify any text you want to use between variables in the format string.

        Special Characters

        \nline feed
        \rcarriage return
        \ttab character
        \\backslash character
        %%percent sign character

        Data Variables

        %Status%Whether or not the machine was audited successfully
        Returns OK or Err
        %AuditStampVersion%Audit stamp version number
        %ContactFailures%Number of consecutive contact failures
        %SecsSinceLastSet%Number of seconds since time was last set
        %Variance%Variance from reference at time of audit
        %LastContact%Time this machine was last contacted
        %SerialNumber%Machine's serial number
        %LastProtocol%Name of last time protocol used to set the time
        %LocalTime%Local time (adjusted for timezone and dst) at time of audit
        %UTC%UTC time at time of audit
        %LastVariance%Variance last time machine corrected its time
        %Corrections%Number of time corrections since last startup
        %Checks%Number of time checks (whether or not correction made) since startup
        %Errors%Number of times machine encountered an error while checking the time
        %InstallDate%Time this machine's client was installed
        %UnixTime%Time (in seconds) at time of audit (usually matches LocalTime)
        %LastSet%Time machine last corrected its time
        %LastStartup%Time machine last started the time service
        %LastSource%Most recently-used time source
        %TimeZone%Time zone (for example, "Eastern Standard Time")
        %Version%Version number of time software on machine
        %MachineName%Machine's NetBIOS name
        %DNSName%Machine's DNS name (if available)
        %IP%Machine's last-known IP address
        %DST%Y if machine is known to be applying Daylight Savings Time correction
        N if machine is known to NOT be applying DST correction
        ? if machine's treatment of Daylight Savings Time is unknown
        %Role%Machine's Domain Time II role (client, server, etc)
        %Registered%Y if software is registered
        N if software is an evaluation copy (or not a Domain Time component)
        %OS%Name of architecture, operating system, and OS version
        %AverageInfo%List of servers used for averaging (if available)


    Next Proceed to the Cache Settings page
    Back Back to the Discovery page

Domain Time II Software distributed by Microsemi, Inc.
Documentation copyright © 1995-2024 Greyware Automation Products, Inc.
All Rights Reserved
All Trademarks mentioned are the properties of their respective owners.