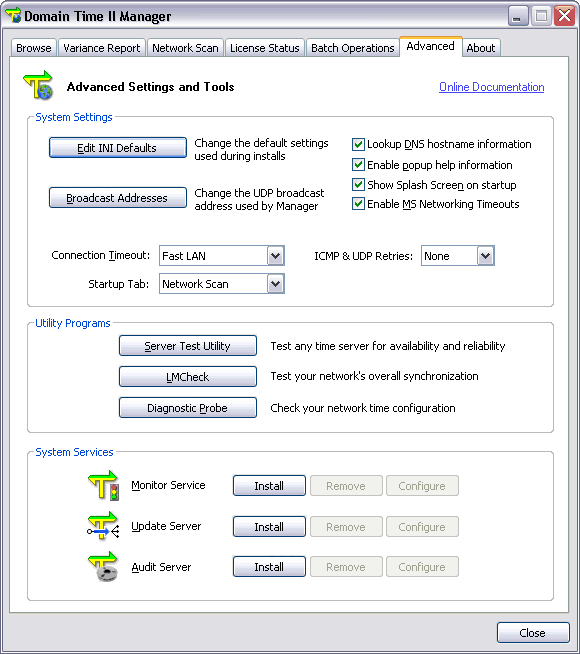
 Domain Time II Manager - Advanced Settings and Tools tab System Settings
Manager uses a template file (DOMTIME.INI, found in the Domain Time II program directory) to set the various configuration options for products being remotely installed.
Since this file controls all installations done from Manager, be sure to review this file carefully to be sure it has correct entries before proceeding with your installations or upgrades. Note that this file is only read during installation. After installation, Domain Time components use the settings recorded in their machine's registry. See the various Registry Settings pages (Server, Full Client, or Thin Client) for more information.
Broadcast Addresses
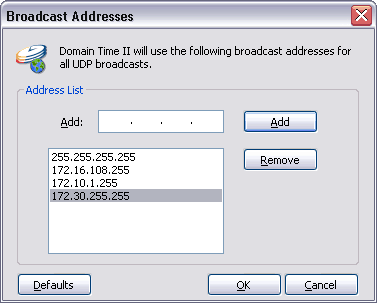 Adding a broadcast address to Manager's Broadcast Address list One of the methods Domain Time II Manager uses to discover remote systems is by UDP broadcasts. By default, it will only send to and receive UDP broadcasts from the local subnet. You can have Manager send broadcasts to other subnets by adding the subnet mask of the remote subnet to this list.
For example, to have Domain Time II Manager send broadcasts to systems on the 172.16.108.x subnet, you would enter 172.16.108.255 into the
Broadcast Addresses list. The list is additive, so you can enter as many subnets as necessary for your network.
Note: There must always be at least one broadcast address entered in this box for Manager to perform correctly. We recommend that you keep the
the default address 255.255.255.255 in the list.
Include DNS hostname information
Enable popup help information
Show Splash Screen on startup
Enable MS Networking Timeouts
Connection Timeout
When Manager is scanning the network, it will wait a pre-determined period of time for a machine to respond before deciding that machine is not responding and move on to the next. If you are scanning or connecting to machines across a slow connection, such as over a dial-up modem or a WAN, the additional network delays and latencies can cause Manager to incorrectly conclude that a machine is unavailable. You can increase or decrease the timeout period by selecting an appropriate value from the list. They are listed in order of timeout length from the shortest (Fast LAN) to the longest (Satellite Link). You should choose the shortest timeout that works on your network.
ICMP & UDP Retries
Startup Tab
Utility Programs Click on the button of one of these useful diagnostic and comparison utilities to launch it. These utilities can also be run stand-alone from the Domain Time II Program Files directory (usually C:\Program Files\Domain Time II).
Use this utility to test the clock stability of any time server.
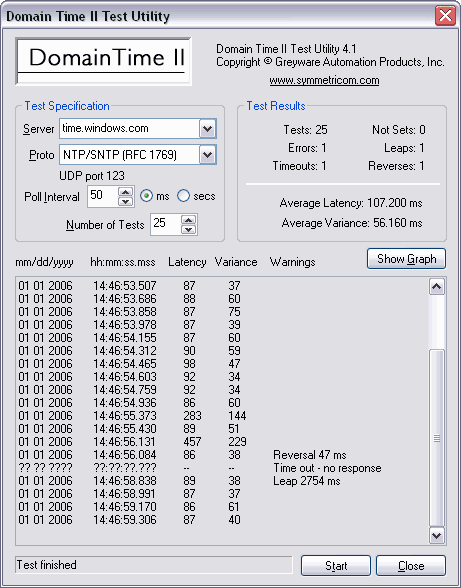 The DTTest Time Server Test Utility To test a time server:
You may also wish to adjust how many times and how rapidly to test each server by adjusting the Poll Interval and Number of Tests items. However, the default settings should be sufficient for most situations. The test will show a running list of the amount of latency detected in the network connection, and also how large a variance exists between your local system clock and the server being tested. Since both the local machine and the remote system clocks and protocols have some built-in inaccuracies, the values displayed will fluctuate occasionally. However, you should be able to see an overall trend in multiple tests - stable clocks will show a fairly consistent variance, unstable clocks will have constantly varying values.
LMCheck (LMCHECK.EXE)
Time variances from the machine on which you run LMCheck are calculated and displayed, taking into account any network latencies.
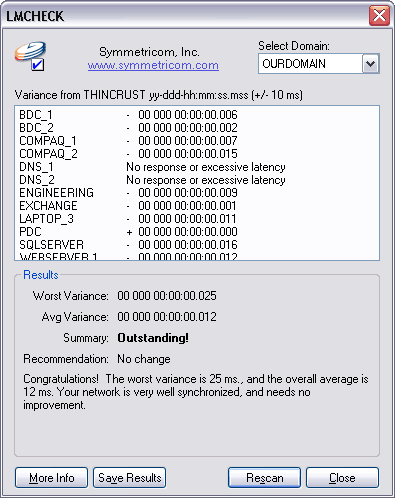 A fully synchronized network The LMCheck tool does not run on WFWG/Win9x/ME.
Click the Start button to perform the scan. Click the Save Results button to pull the results up in Notepad so that you may save them wherever you wish. Note that the variance report generated by LMCheck cannot be as detailed or as accurate as variance reports provided by the Domain Time II Manager, the Monitor Service or the DTCheck utility, each of which use more accurate time protocols and sampling methods to measure the time differentials. Also, LMCheck cannot measure any systems not running Microsoft Networking.
Diagnostic Probe (DTPROBE.EXE)
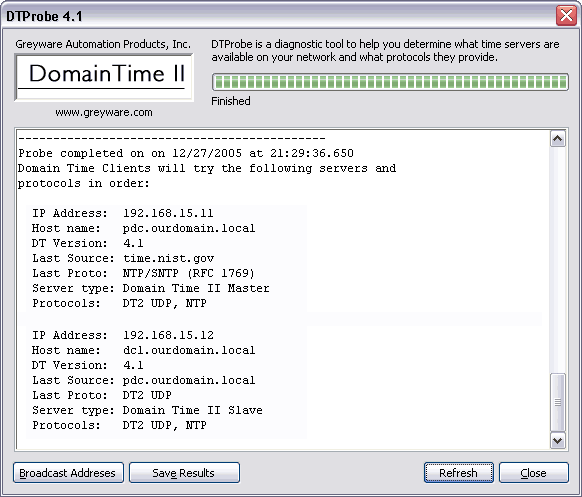 The Diagnostic Probe Utility This utility performs the same server discovery process that the Thin and Full Client (Automatic Settings mode) perform when they attempt to discover a time server. This process is detailed and recorded by the utility so that you can see exactly what servers are locatable and available to clients. This information is extremely useful for tracking down connection problems for automatic clients. This utility can be run on the client machine as well, so that you can see the network from its perspective. Copy the DTPROBE.EXE program to the client machine and launch it there. Use the Broadcast Addresses button to modify the broadcast addresses used by the utility. To be useful, these entries should duplicate the ones that the client uses (usually 255.255.255.255) - see the discussion about setting the client broadcast addresses using Manager via the Options button on the Connection Details screen. See also the Working Across Subnets page for more information. Click the Start button to perform the scan. Click the Save Results button to pull the results up in Notepad so that you may save them wherever you wish. System Services This section of Advanced Settings and Tools allows you to install and configure the two main Management Tool system services and Audit Server (if you have purchased it).
Monitor Service
Update Service
Audit Server

|


