![]()
Version 4.1 Domain Time II Monitor is a system service that runs in the background to periodically collect variance statistics from your entire network, and also raise alerts if time variance on any machine exceeds the tolerances you specify. The Monitor Service is designed to ensure that network administrators are alerted in the event that the system time on any machine being monitored becomes out-of-sync with the primary time source. The Monitor Service also keeps historical records of your variance scans so that you can easily spot changes over time or find errors that would otherwise have gone unnoticed. The Monitor Service is intended only for simple monitoring tasks. You'll want to use Domain Time II Audit Server for more accurate results, notifications of non-responding machines, inclusion of NTP servers and Domain Time II Windows Time Agents in the monitoring, and true historical record-keeping.
Important Installing the service The Monitor Service is installed from the Advanced Settings tab page of Domain Time II Manager. Click on the Install button to begin the installation.
Monitor Service Control Panel Applet Once the Monitor Service has been installed, you may configure the service using its Control Panel applet. You can start the applet from the Advanced Settings and Tools tab page of Domain Time II Manager or directly from the Control Panel.
Note: On Vista with UAC enabled, you must Shift+Right Click and choose Run As... from the context menu to launch the Control Panel applet. On Windows Server Core, type in
Monitor Settings Use the Domain Time II Monitor Control Panel applet to configure the Domain Time II Monitor Service. Configuration is extremely simple.
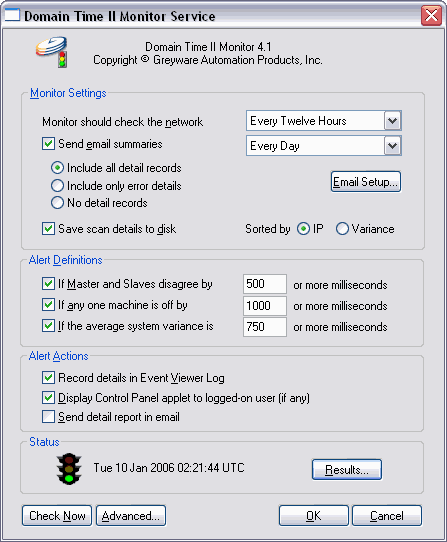 The Monitor Service Control Panel Applet
Monitor should check the network
Send email summaries
Include only error details No detail records
Save scan details to disk Sorted by IP
Variance
Email Setup In order for variance reports and alerts to be sent by email, you need to fill out the fields in the Email Setup screen.
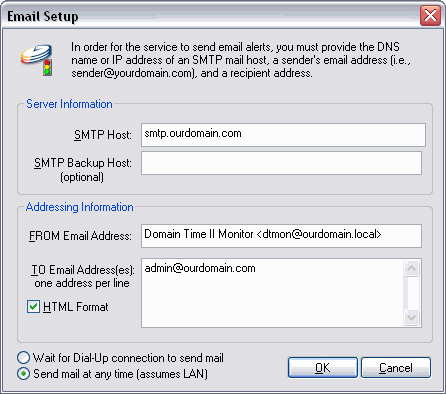 The Email Setup dialog
Enter the DNS name or IP address of the SMTP server you wish to use.
SMTP Backup Host: Addressing Information
This is the address that will be used as the FROM address. This can be any address your SMTP server is able to treat as a valid incoming address.
TO Email Addresses
HTML Format
Dial-Up Networking Settings
Use this setting if this machine only connects occasionally to the network using a dial-up networking connection.
Send mail at any time (assumes LAN)
Alert Definitions The items in this section allow you to specify the type and amount of time variance that will be tolerated before Monitor generates an alert.
If Master and Slaves disagree by or more milliseconds The synchronization between the master and its slaves is critical to overall time accuracy on the network. It is a good idea to specify a closer tolerance for these systems than for others on the network. If any one machine is off by or more milliseconds This specifies the outside limit of variance for any single machine, regardless of its role (server or client). If the average system variance is or more milliseconds
Alert Actions Settings in this section define the actions that Monitor will take when an alert is triggered.
Display message to logged-in user When this box is checked, Monitor will pop up the control panel applet with a warning message to the user logged on to the machine running Monitor. Send detail report in email When this box is checked, Monitor will send error messages and details to the email recipients specified above. Status
Results
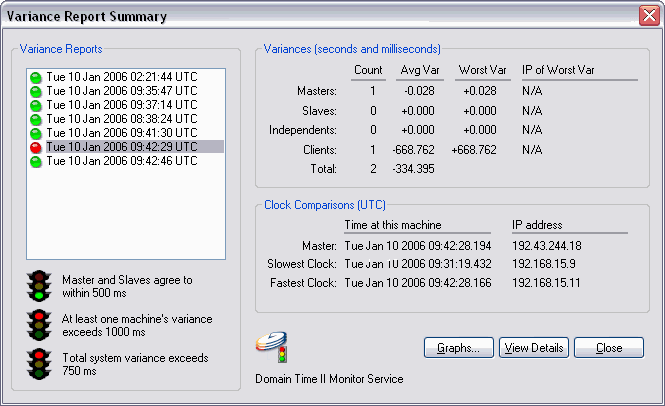 The Domain Time II Monitor Service Variance Report Screen Reports written to disk are displayed in the Variance Reports window. You can double-click on any report to pull it up (or highlight it and click the View Details button). This allows you to easily keep and review historical records of your variance reports. Note: You must have the Save scan details to disk option checked in the Monitor Settings section of the Control Panel applet for the historical reports to be kept and displayed here. Notice that summary details from each variance report are displayed in the Variances and Clock Comparisons sections of the window when you highlight a historical record. You can view the complete details of the historical record by clicking the View Details button.
Graphs
Click this button to bring up the Advanced Settings page.
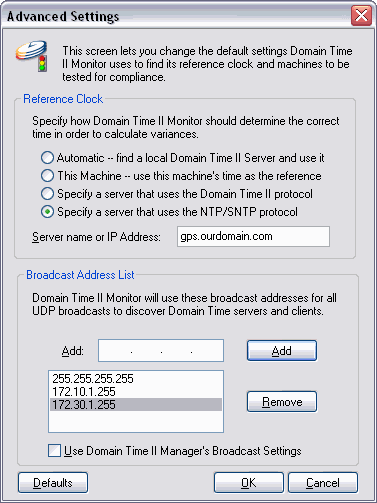 The Domain Time II Monitor Service Advanced Settings Screen Reference Clock Select which system to treat as the reference clock for variance reports using the radio buttons in this section. All variances in the report will be calculated from this clock.
When this button is selected, Monitor will use the first Domain Time II Master Server it locates as the reference clock. If no master can be located, Monitor will try for a slave, then an independent server, and finally (if no Domain Time II servers can be located), it will use its own time.
This Machine - use this machine's time as the reference
Pick a specific machine
Enter the DNS name or IP address of a Domain Time II Server you want to use as the reference.
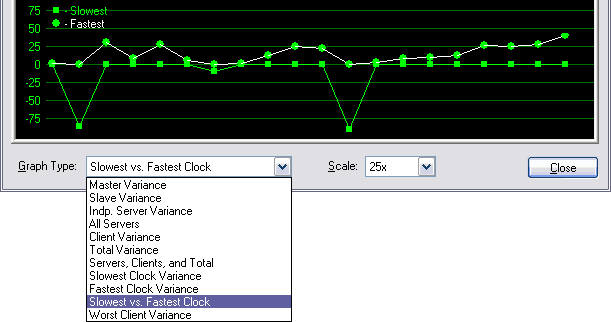
Specify a server that uses the NTP/SNTP protocol Important: Choosing a stable and reliable reference clock is critical to provide useful variance data on your network. If the reference clock's time varies greatly, your network will show large variances from sample to sample even if your network is actually well-synchronized. This graph shows the disastrous results of changing from a stable local GPS clock as a reference to an unstable internet source (time.windows.com):
 The first 8 data points are using a stable local GPS clock as the reference clock, the remainder are from an unstable Internet source See many other interesting graphs on the Graphs page. Broadcast Address List Enter the broadcast address for subnets that you wish Monitor to scan for machines to sample. You can have Monitor use its own broadcast mask list or use the overall Broadcast Address settings from Manager's Advanced Settings and Tools page.
|