Documentation\Configuration\Miscellaneous\Graphs
|
Many Domain Time II programs contain graphs that help you visually determine how your systems are performing. This page explains
about the items on the graphs, and also shows you various comparison graphs to give you an idea of how useful they can be at
analyzing time performance.
Graph Legend
Domain Time II Graphs share common features and display characteristics.
- Graph Scale
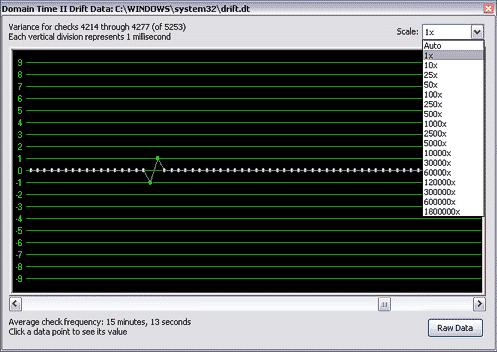
Each graph allows you to adjust the scale used to plot the graph to the level that shows you the most information. The Auto
setting will usually adjust the scale so that all data will fit in the display area. In some cases, the Auto setting will derive the
scale to be used from other settings in the program.
- Data Points
Each data point on the graph is based upon data collected by the reporting program. At least two data samples are necessary to be
able to construct a graph.
Color
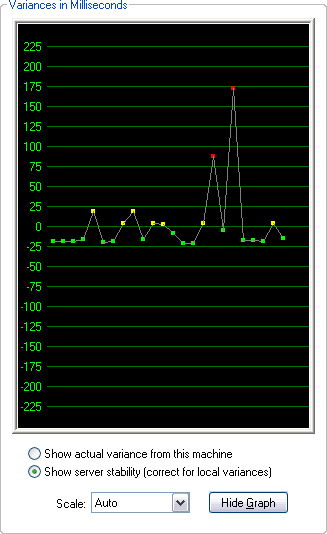
The color used to represent the data point is based on the following criteria:
 The clock matched the time source, no sync was done The clock matched the time source, no sync was done
 The clock was fewer than 55 ms off from its source when it was synchronized The clock was fewer than 55 ms off from its source when it was synchronized
 The clock was fewer than 125 ms off from the source The clock was fewer than 125 ms off from the source
 The clock was more than 125 ms off from the source The clock was more than 125 ms off from the source
Graph Types
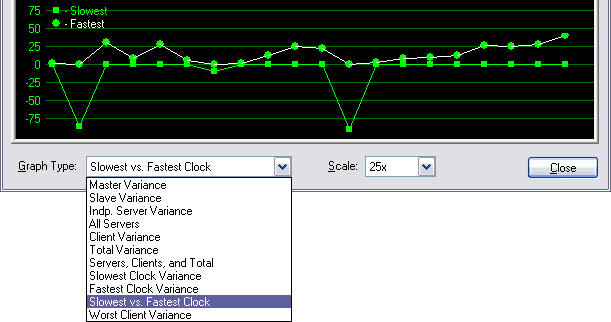
Each Domain Time II component that provides graphs displays the graphs in a format appropriate to that application.
- The graphs from the Domain Time II Monitor Service are typically the most flexible and provide the most information,
since many types of historical data are available to draw upon.

- The DT Test utility lets you select the machine whose clock you want to graph.

- The DTTray System Tray applet provides a drift graph showing the performance of the local clock on individual systems.

|
